Decoding International Viewer Choices via Aggregated Cinema Release Metrics
Written by Willa Fischer · Jul 26, 2026
Decoding International Viewer Choices via Aggregated Cinema Release Metrics
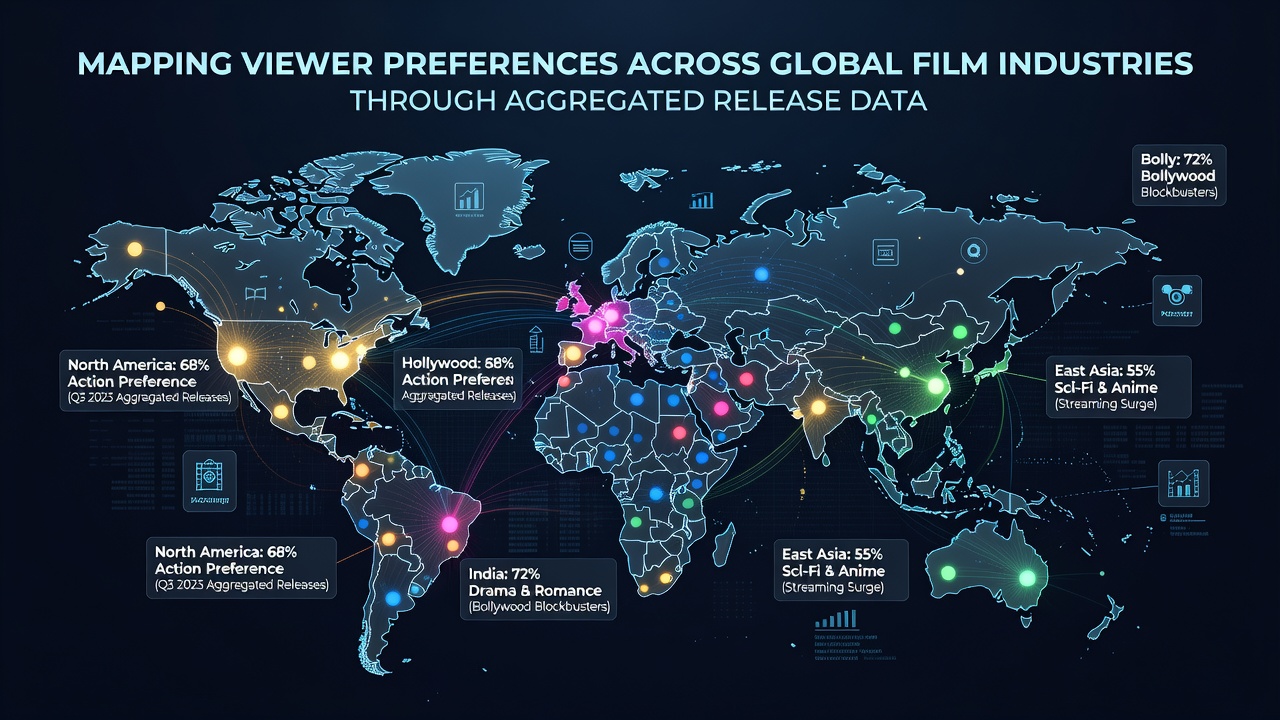
Release data from multiple film markets reveals clear patterns in what audiences select when given options across different territories, and analysts compile these figures from distributors, exhibitors, and streaming services to build comprehensive maps of preferences. Researchers at institutions such as the European Audiovisual Observatory track openings, run lengths, and revenue splits by genre, language, and format, which allows them to identify clusters where certain story types dominate over others. In practice this means compiling weekly box office reports alongside on-demand viewership numbers, then cross-referencing them with demographic and geographic tags so that shifts become visible over time.
How Aggregated Figures Highlight Regional Patterns
Data collection begins with standardized reporting from major circuits and platforms, and once cleaned these records feed into models that compare performance across borders. Observers note that action titles often secure longer theatrical windows in markets wth strong multiplex infrastructure, whereas dramas achieve steadier streaming numbers in regions where subtitled content faces fewer barriers. Because the same film can appear under different release strategies, analysts adjust for timing differences and marketing spend before drawing conclusions about genuine audience interest.
Studies from the Canadian Media Fund demonstrate that animation performs consistently across age groups in North American and Australian territories, while live-action family films show more variance depending on holiday calendars. Those who aggregate the numbers also separate first-weekend spikes from sustained legs, which helps distinguish between curiosity-driven openings and repeat-viewing loyalty. The result is a layered picture rather than a single ranking, and this layered view makes it easier to spot when preferences evolve within a single country over successive quarters.
Comparing Major Industries Through Distribution Records
Hollywood output dominates global volume in many datasets, yet local productions in India, South Korea, and Nigeria frequently outperform imported titles in their home markets when measured by attendance per screen. Aggregated release calendars show that Bollywood musicals maintain high occupancy rates during festival seasons, while Korean thrillers travel better to Southeast Asian and Latin American screens. Analysts adjust for screen counts and ticket prices so that direct comparisons remain meaningful, and these adjustments reveal that genre popularity does not always follow production origin.
European markets display their own distinctions. French comedies retain strong domestic legs even when international releases are modest, whereas German historical dramas travel more readily through festival circuits. Data compiled through 2025 indicates that Spanish-language titles from both Spain and Latin America increased their share of European streaming libraries, and this growth coincided with expanded subtitling and dubbing investments by platforms. Such trends become visible only when release dates, marketing windows, and catalog additions are tracked together rather than in isolation.
Streaming Platforms and the Expansion of Available Data
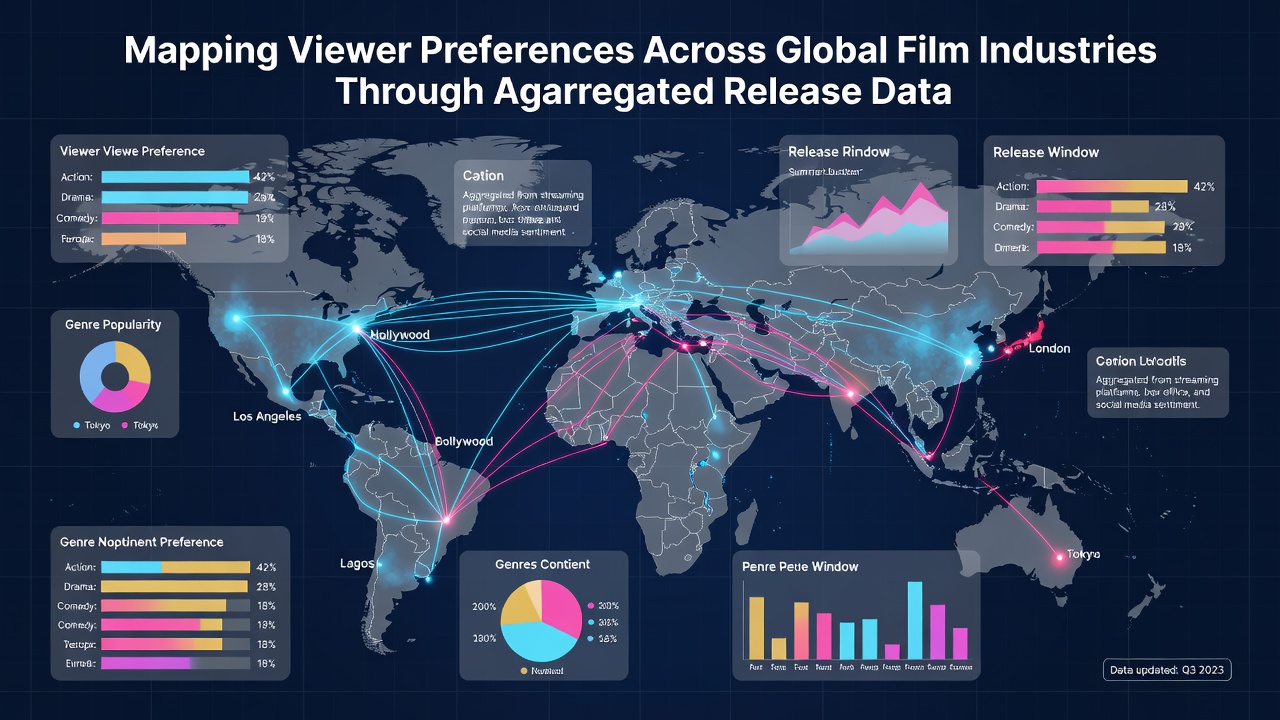
Streaming services publish limited territory-specific charts, yet third-party measurement firms combine public announcements with device-level samples to estimate viewership. These estimates, when joined with traditional theatrical figures, show that science-fiction and fantasy series maintain steadier engagement across time zones than weekly theatrical releases can achieve. In July 2026 several platforms expanded their reporting granularity for select markets, which allowed researchers to confirm that non-English language originals captured larger shares of watch time in English-dominant regions than they had two years earlier.
Because streaming catalogs remain available long after initial release, cumulative viewership numbers capture slow-burn preferences that theatrical windows miss. Analysts therefore treat catalog performance as a separate metric from premiere spikes, and this separation clarifies why certain independent titles accumulate larger audiences over months rather than days. The combined dataset therefore includes both front-loaded and long-tail consumption, giving a fuller account of what viewers ultimately choose when access is not limited by geography or schedule.
Challenges in Standardizing Global Release Information
Differences in reporting standards across countries create gaps that analysts must bridge with statistical modeling. Some territories release detailed daily figures while others publish only monthly aggregates, and currency fluctuations further complicate revenue comparisons. Researchers address these issues by converting everything to normalized indices such as admissions per million population or revenue per screen, which reduces distortion from population size or ticket pricing. Even with these adjustments, incomplete coverage in emerging markets remains a constraint, and teams often supplement official numbers with satellite imagery of parking lots or social-media sentiment samples to estimate unreported activity.
Another complication arises when the same title receives staggered releases or simultaneous drops on multiple platforms. Cross-referencing schedules from trade publications and company filings helps isolate the effect of each window, yet timing overlaps can still blur attribution. Observers therefore emphasize transparency about methodology when publishing comparative charts, and this transparency allows other teams to test alternative weighting schemes against the same underlying records.
Conclusion
Aggregated release data supplies the raw material for mapping viewer preferences across borders, and the resulting maps grow more detailed each year as new sources and finer reporting standards come online. By combining theatrical admissions, streaming hours, and demographic tags, researchers produce objective pictures of which genres, languages, and formats resonate in different territories. Continued improvements in data standardization will further reduce estimation errors and allow more precise tracking of how preferences shift in response to economic, technological, and cultural changes.